The Problem with Most S/R Indicators
The most common criticism of S/R trading is that it is subjective — two traders looking at the same chart draw different lines. This is partially true, but the more significant problem is that most traders draw too many lines. When a chart has fifteen levels marked across the visible range, traders will always find one near wherever price is — and will convince themselves that each reaction confirms the level’s validity.
This cognitive bias leads to effective confirmation of random levels. If you draw enough lines, price will react near at least one of them on almost any candle. The solution is not to draw fewer lines arbitrarily — it is to score levels by objective criteria at the point of formation and display only those that meet a minimum quality threshold. This shifts level selection from subjective pattern matching to an objective process that can be evaluated statistically.
What Makes a Quality Level
Three factors at the point of formation determine the quality of a support or resistance level: the strength of the rejection that created it, the volume at that rejection, and the subsequent touch history.
Rejection strength is measured by wick size relative to ATR. A level formed by a candle with a large rejection wick demonstrates that when price reached that level, it encountered significant opposing pressure. A level formed by a small-wick candle demonstrates less conviction.
Volume at formation indicates institutional participation. A rejection on above-average volume is more significant than one on below-average — the former suggests large participants actively defending the level.
Touch history tracks how many times price has retested the level since formation. Multiple successful retests are more significant than an untested level. However, levels tested five or more times lose score — overworked levels have had their orders progressively absorbed, reducing their ability to hold future tests.
The Scoring System
Each level begins with a score derived from the three formation factors. The score changes dynamically after formation. Retests add points — each time price approaches and holds the level, the score increases. Score decay applies gradually when a level has not been tested for 100 or more bars. When a level is broken decisively — price closes through it — it flips (support becomes resistance), and the score drops by 40%. A broken level is less reliable than an unbroken one, but not worthless — many of the most reliable trades come from retests of recently broken levels.
Zone Management Over Time
A chart over weeks will generate dozens of potential S/R levels. Displaying all of them recreates the clutter problem the scoring system is designed to avoid. Zone management controls this by displaying only a defined number of the highest-scoring levels nearest to the current price, distributed equally above and below.
The proximity filter is important — a level that formed six months ago and has decayed below the display threshold is not shown even if it was once high-scoring. The levels most relevant to current decision-making are those that are both high-scoring and proximate to price. Zones tested more than five times receive a saturation penalty, preventing permanently displayed levels that have been too heavily traded to retain their original significance.
Classical Pivot Systems as Overlay
Classical pivot systems — Classic, Camarilla, Fibonacci, Woodie, and CPR — calculate support and resistance levels mathematically from the prior period’s high, low, and close. These levels are independent of swing-based analysis, making them valuable as a second opinion. Each pivot system has different characteristics. Classic pivots are the most widely referenced. Camarilla produces tighter levels preferred by shorter-term traders. CPR adds the Central Pivot Range — particularly useful for identifying whether the current day is likely to be trending or consolidating based on the prior day’s CPR width.
Confluence Detection
When a scored S/R zone falls within a configured ATR distance of a classical pivot level, both methods independently point to the same price. This alignment — marked with a gold border — identifies where two different analytical approaches agree. The institutional logic is straightforward: pivot levels attract orders from pivot-based strategies; scored S/R zones attract orders from swing-based traders. When both point to the same price, the combined order flow is larger and reactions tend to be sharper and more sustained than at single-method levels.
Treating confluence zones as primary trade locations — only entering at gold-bordered levels — is a simple but effective filter that concentrates activity at the highest-quality prices the combined analysis produces.
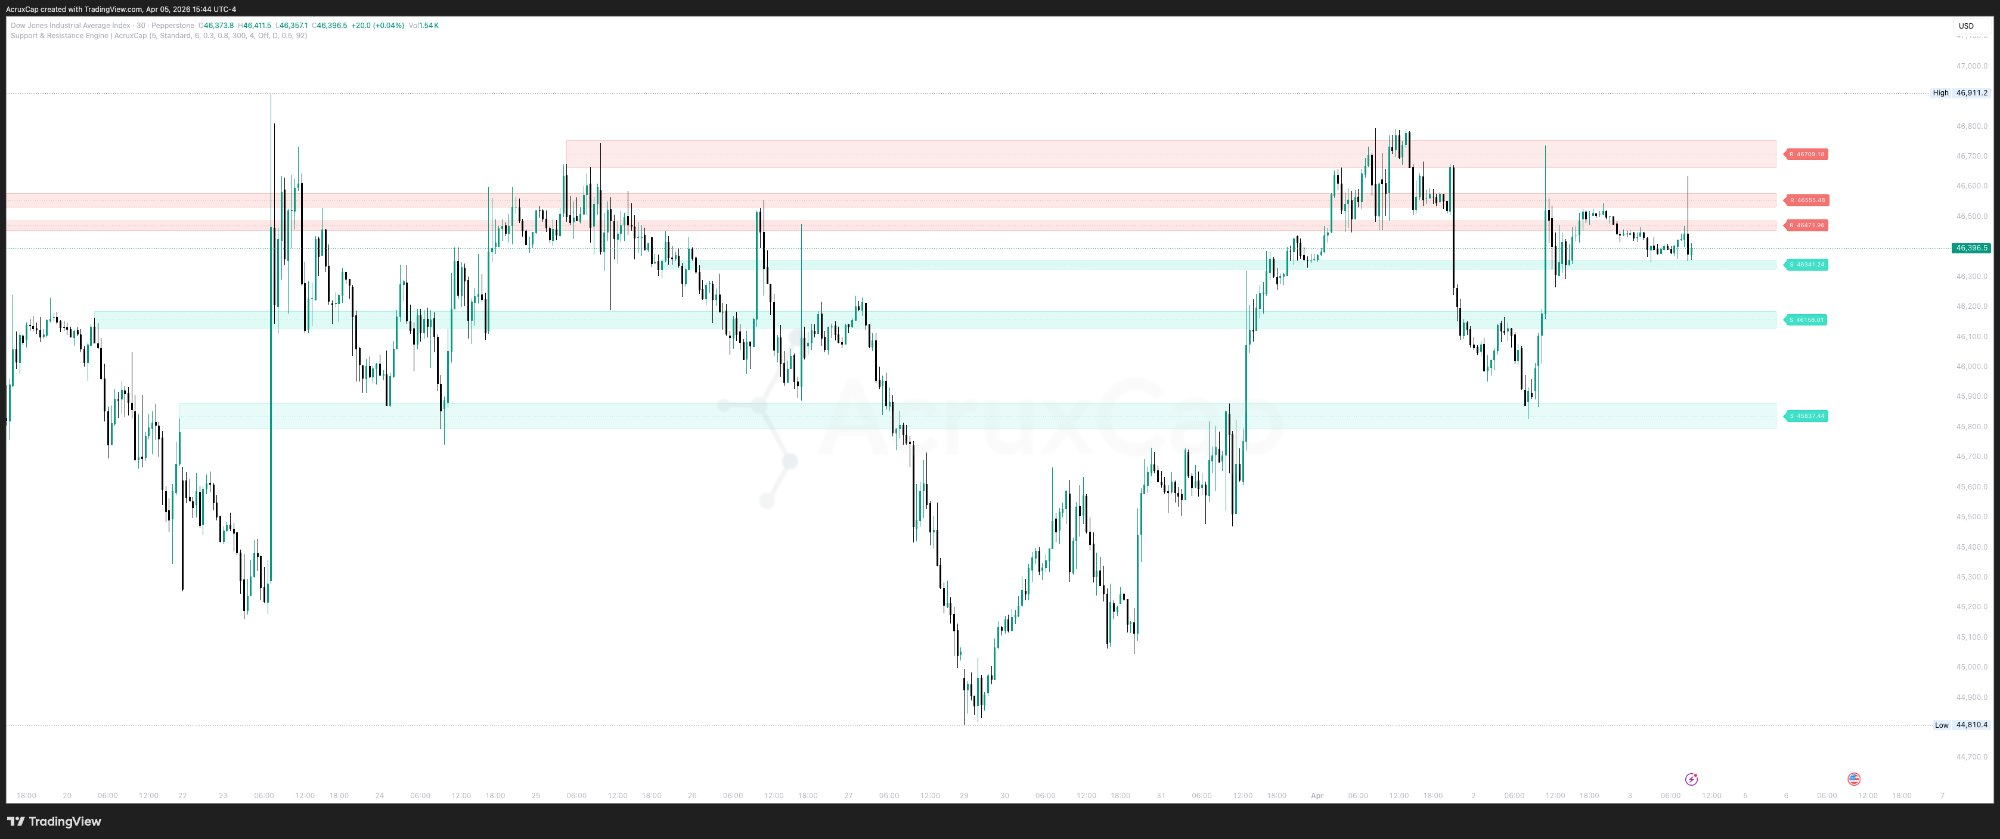
Support & Resistance Engine
The Support & Resistance Engine scores each zone by rejection wick, volume, touch count, time decay, and saturation. Only the highest-quality levels nearest to price are displayed. Five classical pivot systems available as overlay. Gold confluence borders mark where scored zones and pivot levels align. Works on all timeframes and liquid instruments.