New AcruxCap Dashboard is live. 590 stocks · 58 crypto · 25 forex See it in action →
Now Live

Stop searching. Start trading.

Every morning, the dashboard has already done the work — scanning 590 stocks, 58 crypto assets, and 25 forex pairs. You open it, read the playbook, and you know what to do before the bell.

590
US stocks
58
Crypto assets
25
Forex pairs
8
Signal layers
5–30m
Refresh cycle
AcruxCap Stock Radar — contrarian retracement scanner
Stock Radar

The setups other screeners miss.

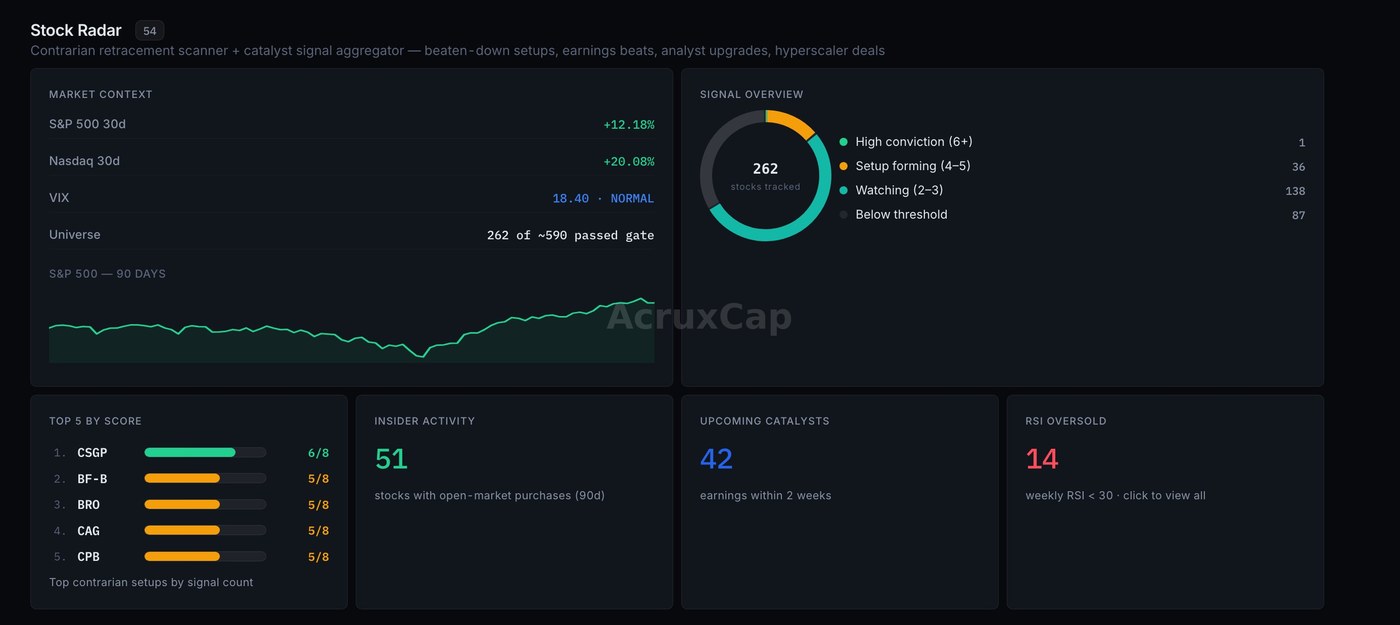
A contrarian retracement scanner that looks for stocks that are beaten down on price but improving on fundamentals. Every stock in the universe is gated through price, volume, and ADR filters before it's scored.

  • Eight contrarian signals scored independently, then combined
  • ATH discount, weekly & daily RSI, revenue acceleration in one card
  • High-conviction vs. setup-forming vs. watching — sorted automatically
  • Insider buying and analyst upgrades surfaced in the same row
590
stocks scored daily
8 / signal
independent layers
AcruxCap Crypto Radar — BTC regime model and phase detection
Crypto Radar

Phases, not noise.

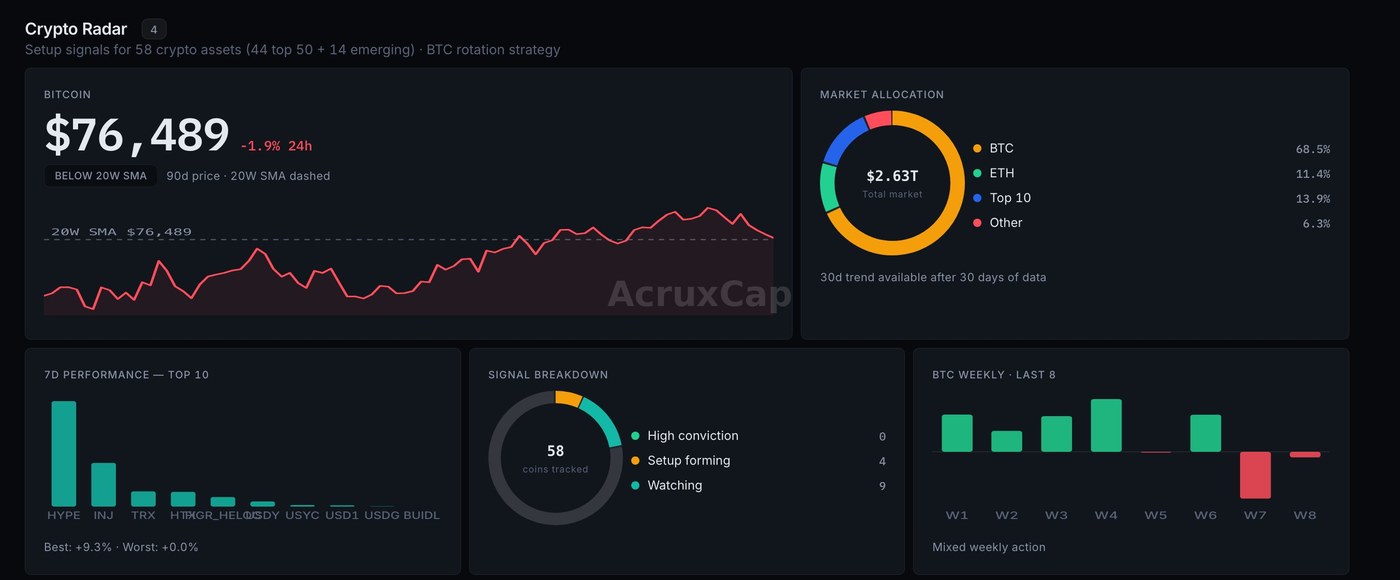
A regime-aware crypto scanner. Every coin is classified by EMA phase, scored against BTC, and ranked by relative strength — so you know whether to be aggressive, defensive, or sitting on your hands.

  • BTC regime model dictates risk-on / risk-off positioning
  • EMA-phase classifier: Bottoming · Uptrend · Topping · Downtrend
  • Beating-BTC leaderboard surfaces real strength, not just up days
  • Rotation alerts when capital shifts between BTC, ETH, and alt buckets
58
coins tracked
4 phases
regime classifier
AcruxCap Forex Radar — directional bias and pip movers
Forex Radar

Bias before you click.

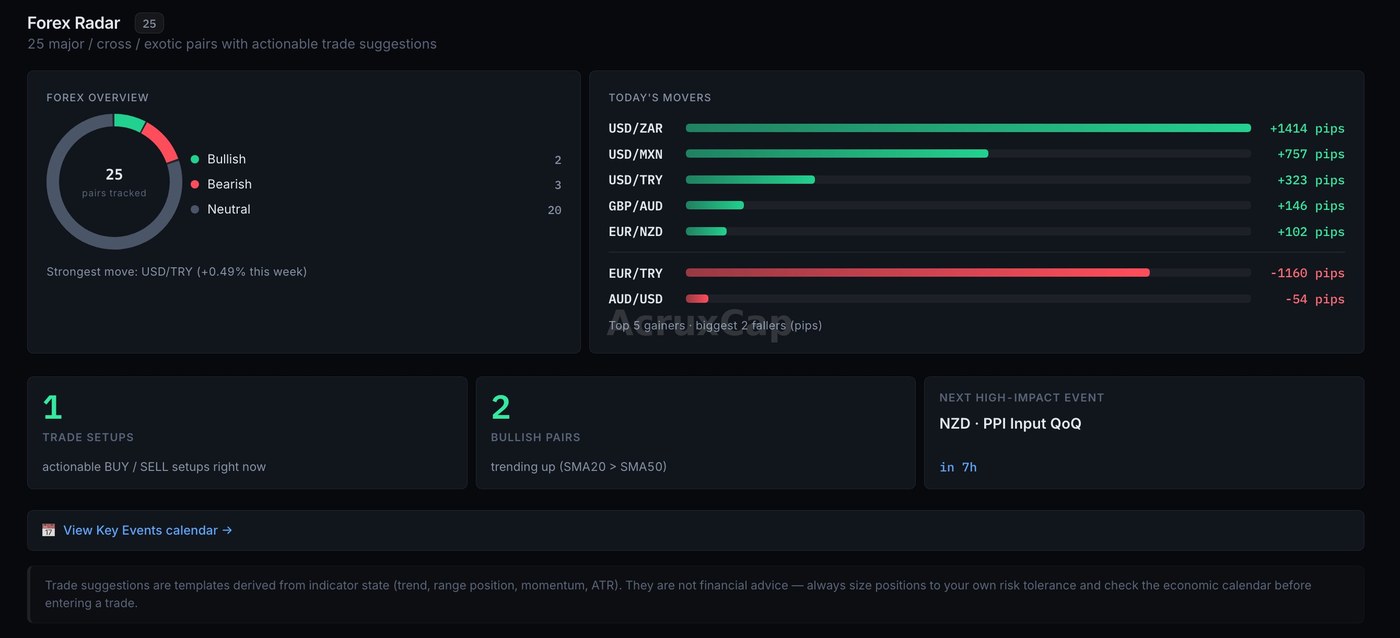
A directional bias engine for the 25 most-traded pairs — majors, crosses, and the exotics worth watching. Daily and 4-hour bias are combined with pip movement and the next high-impact event for the pair.

  • Daily + 4H bias agreement filter for higher-conviction trades
  • Pip-mover leaderboard ranks the day's most aggressive currencies
  • Setup quality flagged by ATR and recent volatility regime
  • Next high-impact news event surfaced inline per pair
25
pairs covered
D + 4H
dual-timeframe bias
AcruxCap Sector Heat Map — sector rotation visualisation
Sector Heat Map

Follow where the money is.

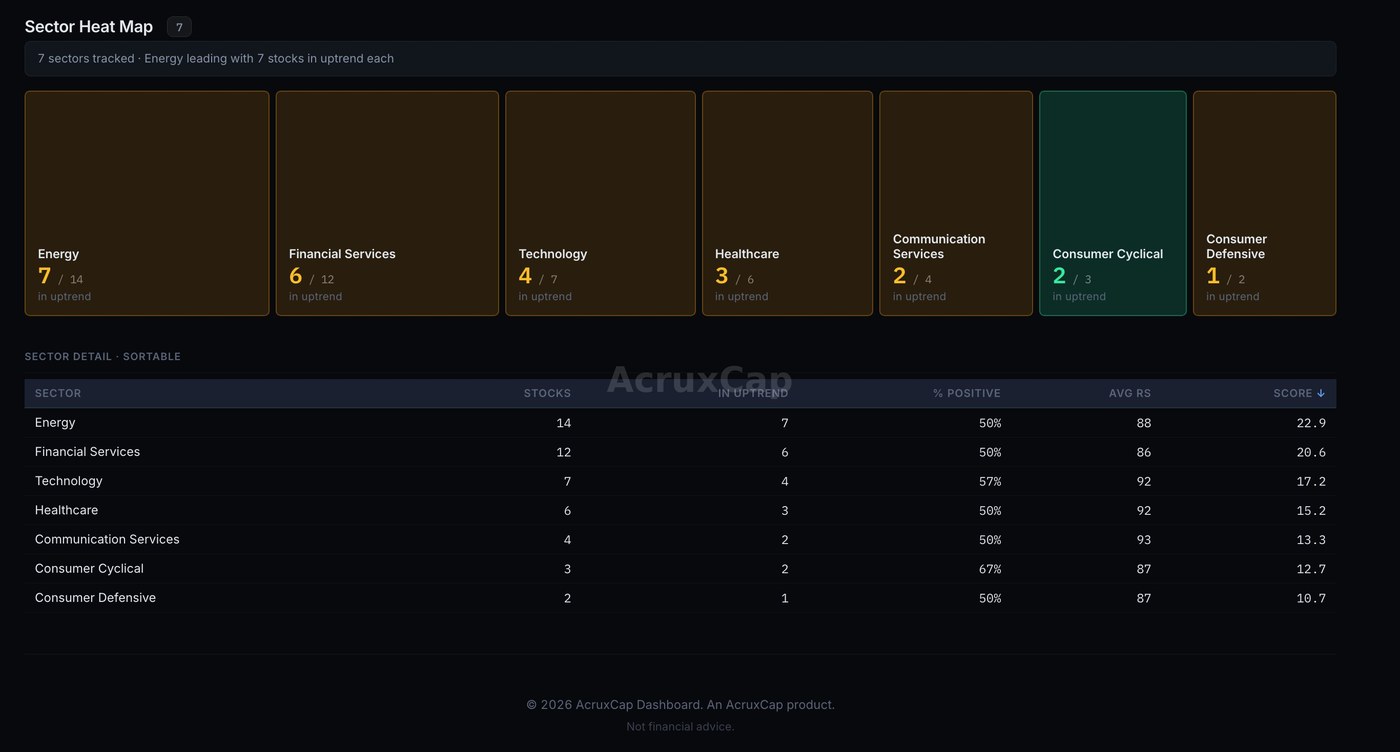
Eleven GICS sectors visualised as a live heat map — uptrend density, relative strength, and short-window performance side by side. The rotation story for the week is visible in five seconds.

  • Uptrend percentage per sector — the breadth view leaders only show
  • 5-day and 30-day relative strength colour-coded against the index
  • Top-performing tickers per sector accessible in one click
  • Highlights when sector leadership rotates — a directional signal on its own
11
sectors mapped
5d & 30d
windows live
AcruxCap Earnings Calendar — filtered with radar overlap
Earnings Calendar

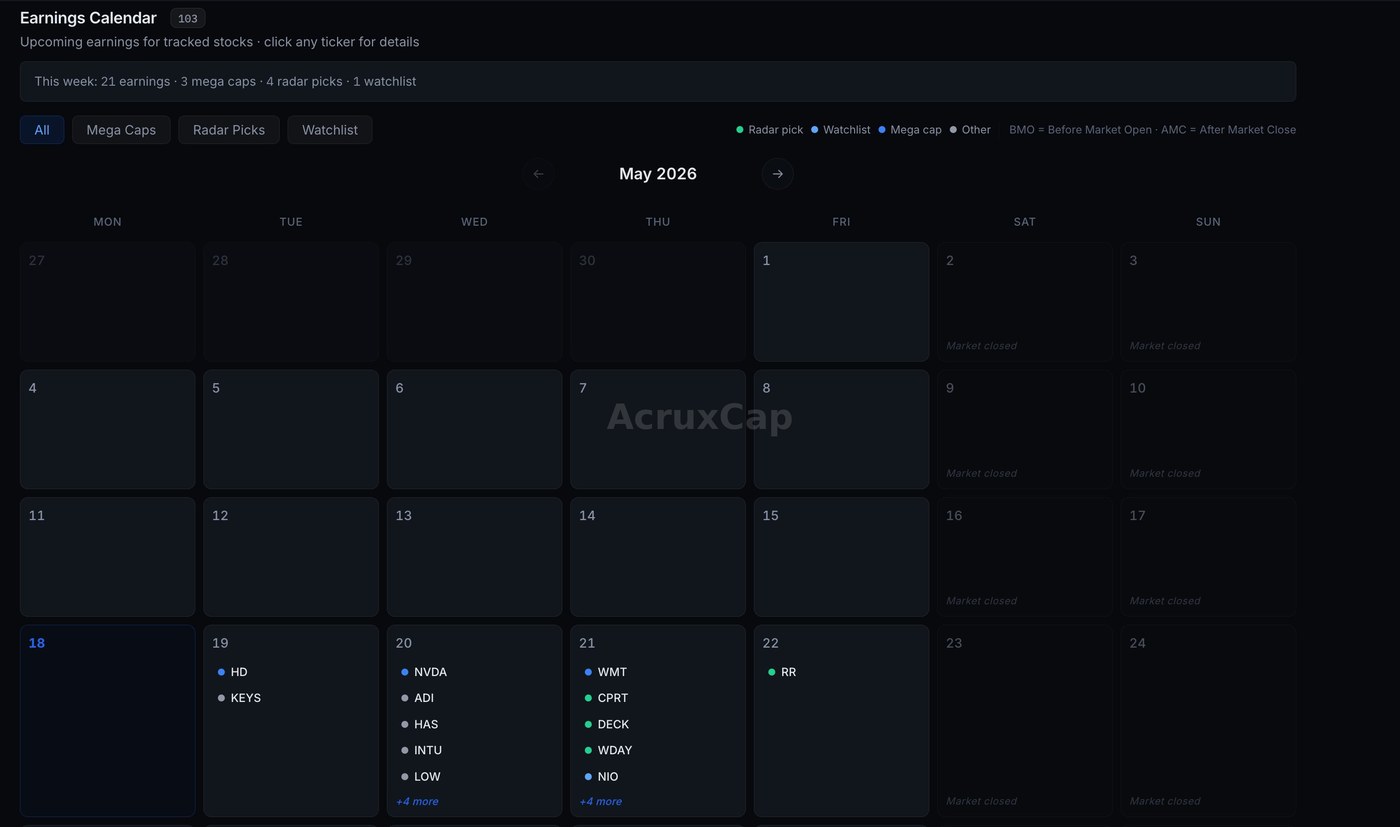
Never get caught off-guard.

A filtered earnings calendar that highlights the names that actually matter — radar picks, mega caps, and anything you're already watching. Pre-market and after-hours splits are pre-sorted.

  • Radar overlap: any earnings name that's also on the stock radar is flagged
  • BMO · AMC labels at a glance, with rank by market cap
  • Five-day forward window prevents surprises on positions you hold
  • Click-through to the radar row for full signal context
5-day
forward view
Radar +
overlap flagged
AcruxCap Key Events — weekly economic calendar
AcruxCap Explorer — per-ticker deep dive
Key Events + Explorer

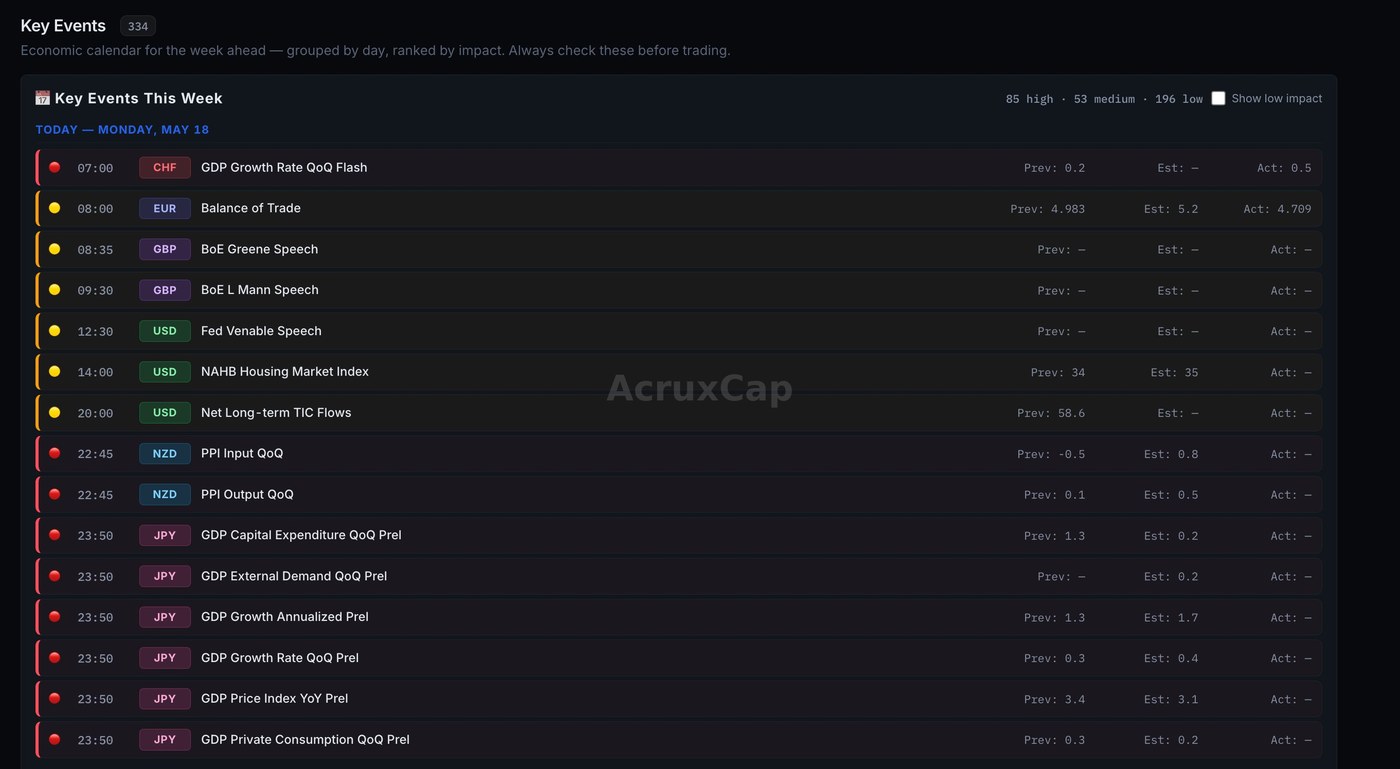
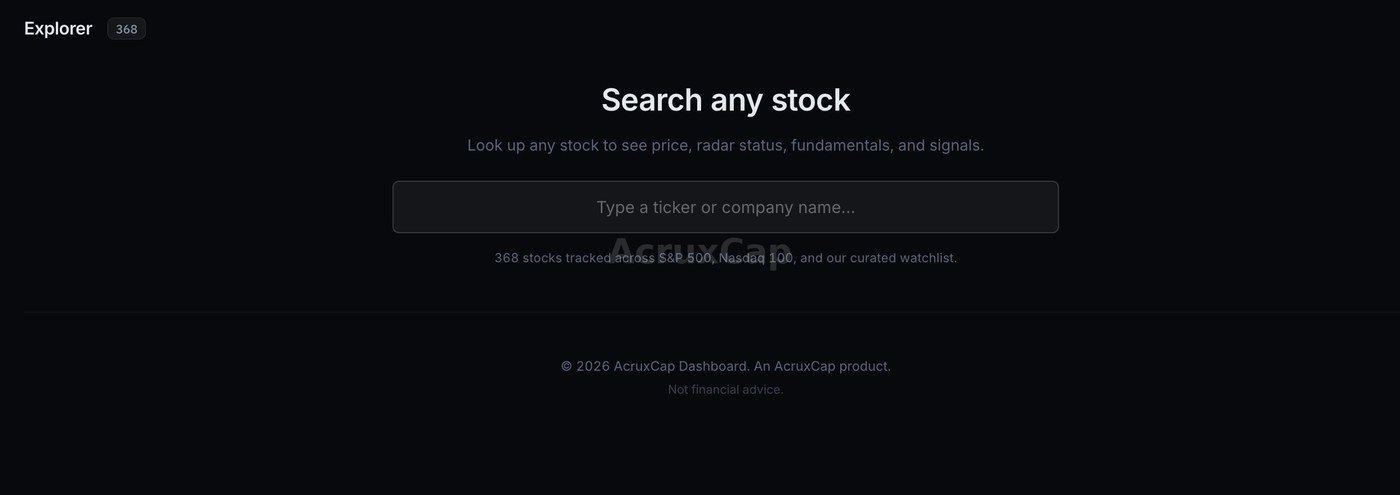
Context first. Tickers second.

The macro calendar tells you what the week looks like. The Explorer lets you go from there to any ticker in the universe — with the full eight-signal scoring and chart breakdown surfaced on demand.

  • Economic events for the week ahead, grouped by day and ranked by impact
  • Visual cues for CPI, FOMC, NFP, and other regime-shifting prints
  • Explorer accepts any ticker — not just the 590 in the daily scan
  • Per-ticker RSI, ATH discount, sector context, and the signal breakdown in one view
High-impact
events flagged
Any ticker
deep-dive view
Signal Logic

8 signals. Every stock. Every day.

Every name in the radar is checked against the same eight contrarian signals. We don't average them — each is scored independently so you can see exactly why a setup is firing.

01 / Price

52W Drawdown

At least 25% off the 52-week high. We want capitulation, not breakouts.

02 / Momentum

RSI Oversold

Daily and weekly RSI both under 30, Wilder-smoothed. The institutional standard.

03 / Fundamentals

Revenue Acceleration

Latest quarter YoY revenue growth faster than the previous quarter. Real improvement.

04 / Sentiment

Insider Buying

Form 4 purchases by officers or directors in the last 90 days. Skin in the game.

05 / Catalyst

Earnings Beat

A recent EPS beat with positive forward guidance. Often mispriced in the days that follow.

06 / Sell-side

Analyst Upgrade

A buy-side rating upgrade in the last 30 days. Sentiment shift from the desks that move size.

07 / Flows

Institutional Accumulation

13F position increases from large holders. Where the float is actually going.

08 / Forward

Hyperscaler Deal

Public AI or cloud contract wins. A leading indicator for the next 2–4 quarters of revenue.

How it works

Built on real data. Honest about what it does.

Every signal you see on the dashboard is calculated from public market data and refreshed on a fixed cadence. The dashboard helps you decide — it doesn't trade for you, and it doesn't claim to predict anything.

Data sources

Public market data via licensed providers — EOD & intraday OHLCV, fundamentals, options flow, earnings calendar, news headlines. No insider feeds, no leaked signals.

Refresh cadence

Stock radar re-scored every 5–30 min during US session. Crypto regime hourly. Forex bias 4× per session. Today's Playbook published 06:00 UK, daily.

What it doesn't do

Not a signal-copying service. Not a robo-advisor. Doesn't place trades. Doesn't guarantee returns. It surfaces — you decide.

Best for

Active traders who already manage their own risk.

  • Discretionary stock / crypto / forex traders who need a daily shortlist
  • Swing traders looking for contrarian or momentum setups across 590 names
  • Anyone who's tired of building radars by hand every morning
  • Traders running AcruxCap indicators on TradingView who want a market-wide layer
Not for

People looking for guaranteed signals or financial advice.

  • Anyone expecting auto-execution or copy-trading
  • Complete beginners with no risk-management framework yet
  • Long-only buy-and-hold investors who don't read intraday setups
  • Anyone who treats a radar score as a buy instruction
Comparison

AcruxCap vs. manual research

AcruxCap Dashboard Manual research Paid terminals
Time to daily brief Auto-generated by 7am 60–90 minutes per session You still need to know what to query
Stocks covered 590 scored every day 5–10 tickers per session Anything you query manually
Signals tracked 8 contrarian layers scored independently 1–2 per ticker, by hand Build your own, or pay extra
Earnings awareness Filtered + radar overlap flagged Standalone calendar tab Standalone calendar tab
Forex bias 25 pairs · daily + 4H Per-pair, drawn manually Per-pair, drawn manually
Crypto regime 58 coins + BTC regime model Mostly BTC-only focus Not built in
Data refresh 5–30 min · soft refresh Whenever you remember to check Real-time (latency varies)
Cost per signal ~$0.34 / signal-day Your hourly rate × 1.5h $2,000+ / month per seat

Figures based on AcruxCap's plan across the daily 590-ticker scan.

Pricing

One plan. Full access.

Monthly and annual subscriptions are listed in the pricing section on our homepage. Pick the billing period that suits you and start today.

View pricing →

Cancel anytime. No lock-in contracts.

Frequently asked questions

What markets does the dashboard cover?
US stocks (~590 gated through price, volume, and ADR filters), 58 crypto assets (top 50 + 14 emerging), and 25 forex pairs (majors, crosses, and exotics).
How often does the data update?
Every 5–30 minutes during market hours. The dashboard uses a soft refresh system — data updates in the background without reloading the page or losing your scroll position.
What does “contrarian retracement” mean?
We look for stocks that are beaten down (deep discount from all-time high, low RSI) but showing signs of recovery (revenue acceleration, insider buying, institutional accumulation). The idea is to buy when everyone else is selling — if the fundamentals support it.
Is this financial advice?
No. AcruxCap provides trading signals and data for educational purposes. Always do your own research and size positions according to your own risk tolerance.
How much does it cost?
Full access to every radar, screener, alert, and feature. Cancel anytime, no lock-in contracts. The AcruxCap TradingView indicator suite is a separate product available on TradingView. See pricing →
Get Started

Ready to see what the market is telling you?

Start Now →