What Smart Money Concepts Actually Describes
Smart Money Concepts is a framework for reading price action through the lens of institutional order flow. The core premise is that large market participants — banks, funds, and central bank desks — cannot fill their positions without leaving observable footprints on the chart. The job of the SMC trader is to identify those footprints, anticipate where institutional orders will next be placed, and position ahead of the resulting move.
The methodology is not a single indicator or a fixed set of rules. It is a way of interpreting market structure: why highs and lows form where they do, what the displacement of price through a level reveals about who caused it, and how imbalances in the order book create zones where price will return to trade.
The language of SMC — order blocks, fair value gaps, liquidity sweeps, breaks of structure — can appear opaque at first. But each concept maps to a specific mechanical event in the market. Understanding what each one actually represents, rather than just what it is called, is what separates traders who use this methodology consistently from those who apply it randomly and wonder why it does not work.
Market Structure: The Foundation Everything Else Depends On
Market structure is the sequence of swing highs and lows that price leaves as it moves. In an uptrend, each swing high is higher than the last and each swing low is higher than the last. In a downtrend, the opposite is true. This is not a new concept — Dow Theory described it over a century ago. What SMC adds is a precise vocabulary for identifying when structure is breaking and what that break signifies.
A Break of Structure (BOS) occurs when price closes beyond the most recent swing high or low in the direction of the prevailing trend. It confirms trend continuation. A Change of Character (CHoCH) occurs when price closes beyond the most recent swing high or low against the prevailing trend. It signals a potential shift in direction — not confirmation of reversal, but the first evidence that the trend is under pressure.
The distinction between BOS and CHoCH matters because it tells you whether you are trading with the institutional flow or against it. A BOS in an uptrend means smart money is still buying. A CHoCH in an uptrend means selling pressure has become strong enough to break the previous structural low — and that changes the probability distribution of what happens next.
Most SMC implementations track structure at two scales simultaneously: a larger swing scale (typically 50-bar pivots) that captures the dominant institutional flow, and a smaller internal scale (5-bar pivots on 1-minute charts) that identifies entry-level structure breaks. The internal scale is where signals fire. The swing scale is what determines whether those signals are with or against the major trend.
Order Blocks and What Makes Them Valid
An order block is the last opposing candle before a displacement move. When institutional buyers accumulate a large long position, they cannot fill it all at one price — the order is distributed across multiple candles. The final bearish candle before a strong bullish impulse represents the candle where the last of that institutional buying was placed. If price returns to that candle, there is a statistical tendency for the accumulated orders to defend the level and cause price to continue in the original direction.
This is the theory. In practice, not every order block is equal, and treating them all the same is one of the most common mistakes in SMC trading.
The quality of an order block depends on three factors: the strength of the displacement move that followed it, the cleanliness of the zone (whether price has returned to it previously and partially consumed the orders), and the relationship between the order block and the higher timeframe structure. An order block in the direction of the 4-hour trend at a level that has not been touched since formation is a high-quality zone. An order block that price has revisited three times in a ranging market is not.
When an order block is broken — when price closes decisively through it — it does not disappear. It flips. A bullish order block that is broken becomes a bearish breaker block, a resistance zone where sellers who were previously trapped will exit when price returns. Tracking this flip is critical to avoiding entries into zones that have already been invalidated.
Liquidity: What Price Is Actually Hunting
One of the most useful reframes in the SMC methodology is thinking about price movement not as directional intent but as liquidity seeking. Institutional participants need liquidity — willing counterparties to fill their orders against — and that liquidity clusters predictably at specific levels on the chart.
Equal highs and equal lows are the clearest example. When price forms two or more highs at approximately the same level, retail traders place stop-loss orders just above those highs and breakout traders place buy orders above them. This creates a pool of resting orders. An institutional participant who wants to sell a large position can drive price above that level, trigger all those orders as buy fills, and use that liquidity as the counterparty for a short entry. The resulting move — price pushing through the level and then immediately reversing — is what SMC calls a liquidity sweep.
Previous day highs and lows, session highs and lows, and psychological round numbers all function as liquidity pools. The SMC trader's job is not to chase the sweep after it happens, but to anticipate which pools are most likely to be targeted next and position accordingly.
The sweep itself is only the first part of the setup. What matters for entry is what happens immediately after: whether price creates a structural shift (CHoCH) on the lower timeframe and whether that shift has a valid fair value gap in the displacement leg. Without the structural confirmation and the FVG, a sweep is just information — it is not a trade.
Fair Value Gaps and the Entry Zone
A fair value gap (FVG) is a three-candle pattern where the first and third candles have no overlapping wick. This gap in the market represents an area of inefficiency — price moved so quickly through that range that normal two-sided trading did not occur. The statistical tendency is for price to return to that gap and fill it, or partially fill it, before continuing in the direction of the original impulse.
In SMC trading, the FVG in the displacement leg of a move serves as the entry zone. After a liquidity sweep and a structural shift, the trade setup is for price to retrace into the FVG — the 50% midpoint of the gap is the conventional entry — and then continue in the direction of the displacement. The FVG defines the entry, the low of the displacement leg defines the stop, and the next significant liquidity pool defines the target.
FVGs vary in quality. A large FVG created by a strong, high-volume displacement candle in the direction of the higher timeframe trend is a high-quality entry zone. A small FVG created by a single low-volume candle in a ranging market is noise. Filtering by size relative to ATR eliminates the majority of low-quality FVGs.
Higher Timeframe Bias: The Gate That Matters Most
Every SMC setup exists within a higher timeframe context, and that context is the single most important filter in the methodology. A textbook bullish setup on the 5-minute chart — liquidity sweep of equal lows, bullish CHoCH, valid FVG, order block support — has a much lower probability of success if the 1-hour chart is in a confirmed bearish trend with price below a major structural level.
The conventional approach is to identify the 1-hour bias first: is price making higher highs and higher lows, or lower highs and lower lows? Is the last significant structural event a BOS to the upside or a CHoCH to the downside? This establishes the directional filter. On the 4-hour chart, the same analysis provides the macro context. Entry-level setups should align with both.
The practical implementation of HTF bias as a gate — not a suggestion, but a hard filter that prevents signals from firing against it — is one of the most significant improvements that can be made to a manual SMC approach. Most traders understand the concept intellectually but override it constantly in live trading when a lower-timeframe setup looks compelling. Encoding the bias as a programmatic gate removes that discretion.
The HTF Zone Proximity Gate
Beyond directional bias, there is a second higher-timeframe filter that significantly improves signal quality: blocking entries when price is at a major HTF supply or demand zone. A bullish setup at a level where the 4-hour chart shows a significant unmitigated supply zone is a low-probability trade — the institutional selling that created that zone is likely to overwhelm the lower-timeframe bullish setup. The HTF Zone Proximity Gate automatically suppresses buy signals when price is at HTF supply and sell signals when price is at HTF demand. This prevents entry into setups that are structurally correct on the lower timeframe but positioned directly into institutional opposing flow on the higher timeframe. It is a relatively simple filter, but it removes a disproportionate number of losing setups.
The Five-Gate Signal Engine: Why Most Implementations Fail
The reason manual SMC trading produces inconsistent results is almost always sequencing. The methodology has a specific trade sequence that must be respected: session opens, liquidity forms, smart money targets that liquidity, the sweep occurs, structural shift confirms the direction, price creates a fair value gap, and the entry opportunity emerges at the retrace. Every one of those steps matters, and they must occur in order.
In practice, traders routinely skip steps. They see an order block and enter without a structural shift. They see a CHoCH and enter without a liquidity sweep preceding it. They see a sweep and enter directly into it without waiting for confirmation. Each of these shortcuts degrades the methodology's edge.
A state-machine implementation enforces the sequence programmatically. The engine cannot advance to the next state until the conditions for the current state are satisfied. It cannot fire a signal until all five gates have passed:
- Kill zone active — the signal can only fire during London or New York sessions, the windows with highest institutional participation
- Liquidity swept — a named level (previous day high/low, Asia session high/low, equal highs/lows) has been swept
- Directional bias locked — the sweep established a clear directional intent, confirmed against the 1-hour HTF bias
- Market structure shifted — a CHoCH has occurred in the intended direction on the lower timeframe
- HTF zone clear — price is not at an opposing higher-timeframe supply or demand zone
Only when all five conditions are satisfied simultaneously does the signal fire. This eliminates the vast majority of marginal setups — not because those setups are necessarily wrong, but because they have not met the full sequence of conditions that gives the methodology its edge.
Three Entry Paths
Once the five gates pass, there are three valid entry paths depending on how price behaves after the market structure shift:
A displacement fire (D) triggers on the CHoCH bar itself when that bar is a strong impulsive candle. This is the most aggressive entry — it catches the displacement as it happens rather than waiting for a retrace. It has the best risk-to-reward on the trade but requires the most conviction because price has not yet confirmed the retrace.
A rejection fire (R) triggers when price retraces to an order block after the CHoCH and shows rejection at that zone. This is the conventional SMC entry — confirmation of the zone holding before committing. It has better confirmation but a smaller move remaining to the target.
A balanced price range fire (BPR) triggers when an overlapping fair value gap from opposing directions creates a balanced range — an area where both bullish and bearish imbalances exist. These zones have the highest statistical tendency to produce strong reactions because they represent maximum inefficiency in both directions.
Signal Tiers
Not all valid setups carry the same weight. Signal quality is graded into three tiers based on the strength of the higher-timeframe confluence at the time of the signal:
| Tier | Requirements | Expected edge |
|---|---|---|
| A+ | 1H and 4H bias both aligned, signal fires within first 60 minutes of session | Highest probability. Full position size appropriate. |
| A | 1H bias aligned, 4H neutral or not checked | Standard setup. Normal position sizing. |
| B | Valid setup structure, HTF confirmation absent or partial | Lower conviction. Reduced size or skip. |
The tiering system makes position sizing decisions explicit rather than discretionary. Most traders size every trade identically regardless of setup quality. Scaling position size to signal tier — full size on A+, standard on A, reduced or no trade on B — compounds the edge of the methodology over a large sample of trades.
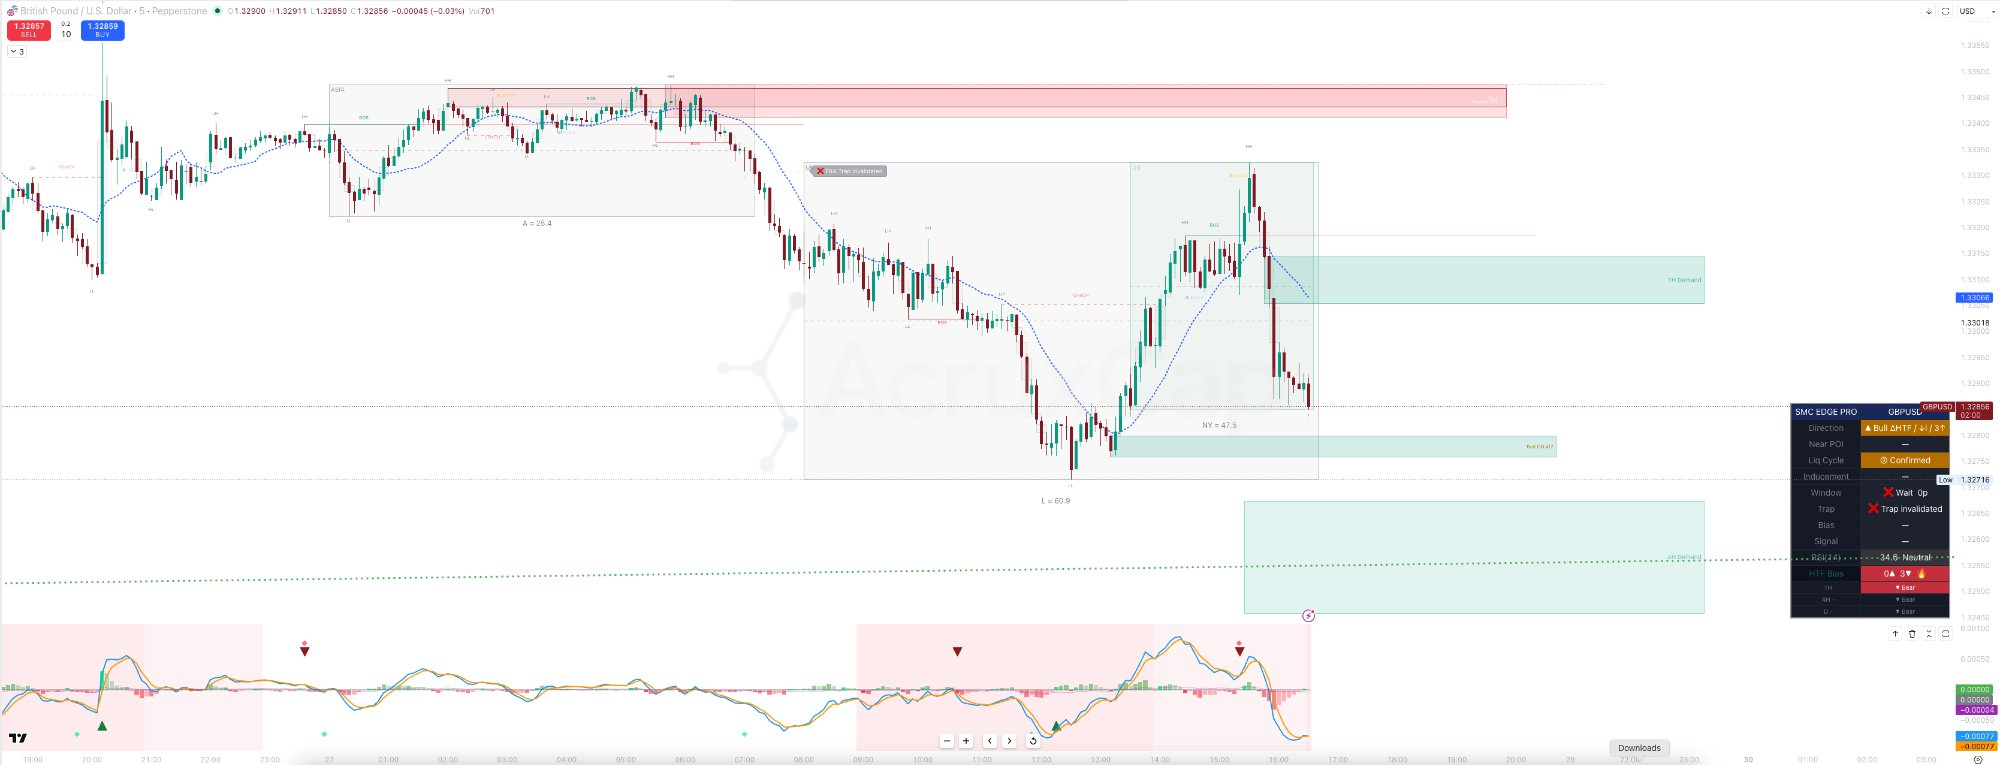
Reading the Dashboard
A well-implemented SMC indicator surfaces its internal state as a readable dashboard so the trader always knows exactly where the signal engine stands. The dashboard should show, at minimum: the current directional bias from the HTF analysis, the liquidity cycle stage (which state the engine is in), whether a named level has been swept, whether the kill zone is active, the current near-POI status from the HTF zone gate, and the status of any active signal.
This matters because it makes the methodology auditable. When a signal does not fire despite what looks like a valid setup, the dashboard tells you which gate blocked it. When a trade fails, the dashboard shows the state at entry so you can assess whether the signal met its own criteria or whether something was marginal. Without this transparency, the analysis of a losing trade degrades into opinion.
Applying the Methodology: Practical Notes
The SMC methodology works best on liquid markets during high-participation sessions. For forex, the London open (07:00–10:00 UK) and the London/New York overlap (12:30–16:00 UK) produce the majority of high-quality setups. For crypto, the New York session (14:30–21:00 UK) is the primary window due to the influence of US equity flows on major crypto pairs.
The 1-minute and 5-minute charts are the primary execution timeframes. The 5-minute chart provides the structural context for internal CHoCH and BOS detection. The 1-minute chart provides entry precision once the 5-minute setup is identified. The 15-minute chart is the boundary: below this, the methodology adapts to institutional intraday flow. Above it, the setup sequence becomes too slow for scalping.
Position sizing relative to ATR — rather than a fixed pip count — is essential for the methodology to perform consistently across different instruments and volatility regimes. A stop placed at 0.5× ATR below the FVG-creating candle adjusts automatically to current market conditions. A fixed 15-pip stop does not.
The single most common error is entering on partial conditions. If the liquidity sweep has not occurred, there is no setup — only speculation about where the sweep might happen. If the structural shift has not been confirmed, the direction is not established. Patience in SMC is not a personality trait. It is a technical requirement of the methodology.
Scored SMC Structure Overlay — Full Implementation on TradingView
Scored SMC Structure Overlay implements the complete methodology described in this article as a TradingView overlay indicator. The five-gate state machine enforces the full trade sequence programmatically — no manual gate-checking required. Order blocks are scored 1–7 based on displacement strength, zone cleanliness, and HTF alignment. The HTF Zone Proximity Gate suppresses entries at opposing institutional zones. All three entry paths (D, R, BPR) are detected. Signal tier (A+/A/B) is displayed on every signal. The dashboard shows the live state of every filter in real time. Designed for 1–15 minute scalping on major forex pairs during London and New York sessions.