What VWAP Actually Measures
Volume Weighted Average Price (VWAP) is the average price at which an instrument has traded throughout the day, weighted by volume at each price level. Unlike a simple moving average, VWAP accounts for the fact that not all prices are equally significant — a level at which a million shares traded matters more than one at which a thousand did.
VWAP is used by institutional participants as a benchmark for execution quality. A buy order executed below VWAP achieved a favourable price relative to the day’s average. A buy above VWAP paid above the market’s average. This makes VWAP a genuine institutional reference level. The practical consequence is that price tends to be attracted back to VWAP during normal market conditions. When price moves significantly above, it is in a premium zone — overextended relative to the institutional reference. When significantly below, it is in a discount zone.
What Bollinger Bands Actually Measure
Bollinger Bands measure price volatility relative to recent history. The outer bands are placed a defined number of standard deviations above and below a central moving average. When price reaches the outer band, it is statistically overextended — not necessarily about to reverse, but in a condition where fewer price points have historically occurred.
The common misuse is treating band touches as automatic buy or sell signals. This produces poor results because Bollinger Bands have no directional context — a band touch in a strong trend is often a continuation signal, not a reversal. Bollinger Band extremes are necessary but not sufficient conditions for mean reversion entries. They indicate overextension. They do not indicate that a reversal is beginning. That confirmation must come from elsewhere.
Why They Work Better Together
The combination solves each tool’s core limitation. Bollinger Bands identify overextension but lack directional context. VWAP provides directional context — whether price is above or below the institutional reference — but does not identify extremes within the day’s range.
When price touches the lower Bollinger Band and is simultaneously in a discount zone below VWAP, two independent methods are pointing to the same condition: price is both statistically overextended and below the institutional fair value reference. This dual confirmation significantly filters the false signals each tool generates individually. Adding a rejection candle as a third condition — requiring price to actively demonstrate rejection rather than merely touching and continuing — further improves entry quality.
The Signal Logic
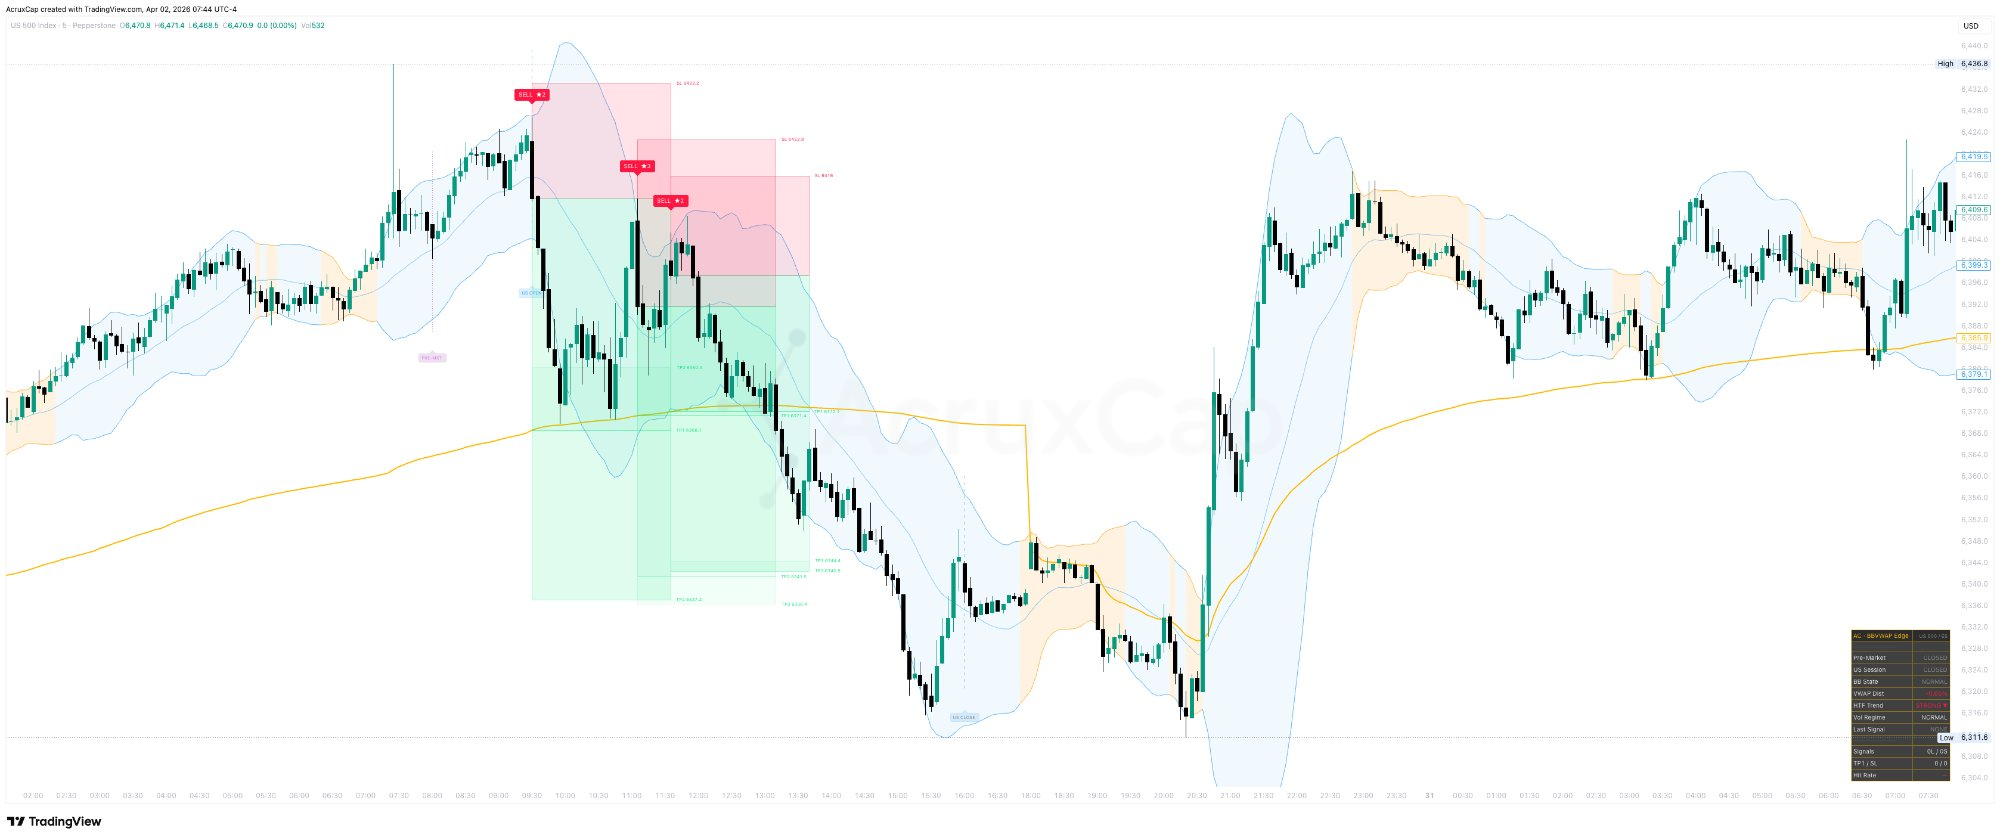
A long signal requires four simultaneous conditions. Price touches or penetrates the lower Bollinger Band. Price is below VWAP. A bullish rejection candle forms, closing in the upper portion of its range. The higher timeframe EMA is not in a strong bearish trend. Short signals require the inverse: upper band touch, price above VWAP, bearish rejection candle, no strong bullish HTF trend.
The rejection candle threshold is adaptive rather than fixed. In low-volatility environments, it tightens to require more decisive rejections. In high-volatility environments, it loosens slightly to avoid filtering genuinely valid signals that have wider candle bodies. This prevents the filter from being too permissive in quiet periods or too restrictive in active ones.
Signal Scoring 1–3 Stars
Not all signals that pass the four core conditions carry the same conviction. A scoring system from 1 to 3 stars grades each signal based on additional confluence factors.
A base score of 1 star is awarded for meeting the core conditions. An additional point is added if price is within the primary VWAP zone. A third point is added if the Bollinger Bands are in a squeeze state at the time of the signal — compression tends to precede expansion, making mean reversion signals during a squeeze carry higher follow-through probability. The minimum score required to display a signal is configurable. In practice, 3-star signals carry the highest win rate but are the least frequent.
The BB Squeeze
A Bollinger Band squeeze occurs when the bands narrow significantly — when price has been compressing into a tight range for an extended period. The squeeze is measured as current bandwidth relative to its percentile rank over the past 100 bars. When bandwidth drops below a configured threshold, the bands highlight and the dashboard flags the condition.
The squeeze matters because compressed volatility typically precedes expanded volatility. A mean reversion signal during a squeeze has a higher probability of a sharp, clean move than the same signal during normal market conditions. Squeeze signals should not be treated as a standalone strategy — they are a filter that upgrades the quality of mean reversion entries when the volatility context is favourable.
BB VWAP Edge Pro
BB VWAP Edge Pro implements the complete mean reversion framework — adaptive rejection thresholds, VWAP with standard deviation bands, HTF EMA filter with slope detection, and 1–3 star signal scoring. Seven instrument presets auto-configure the indicator. Session statistics track daily performance in real time. Three configurable TP levels with VWAP, BB, and ATR-based targets.