Why the NY Session Matters for Crypto
Bitcoin and the major crypto assets are globally traded 24 hours a day. But not all hours are equal. The New York session — running from 14:30 to 21:00 UK time — accounts for a disproportionate share of daily volume, volatility, and directional movement on all major crypto pairs.
The reason is institutional participation. US-based funds, prop desks, and retail participants all become active at the NYSE open. This concentration of capital exerts gravitational pull on correlated risk assets including crypto. When the S&P 500 opens with a risk-on tone, Bitcoin moves. When equities sell off, crypto frequently follows within minutes.
This correlation is not universal or mechanical — it breaks down during crypto-specific events. But during normal market conditions, the directional bias established at the New York open is the most reliable daily signal available to crypto traders.
ETF Flows and the 14:30 Open
The approval of spot Bitcoin and Ethereum ETFs in the US market introduced a structural flow that did not previously exist. At market open, ETF market makers and authorised participants must balance their books. Large inflows drive immediate buying of the underlying asset; large outflows drive selling. This mechanical flow creates predictable directional pressure at 14:30 UK time.
The practical implication for crypto scalpers: the 14:30 candle and the session that follows carry an embedded directional bias from ETF flow. A strong displacement up on the first candle, combined with bullish structure breaks on the lower timeframe, frequently signals ETF inflow and continuation. A weak open with immediate reversal signals the opposite.
Session Structure and Range
The New York session on crypto typically follows a recognisable structure. The first 30–60 minutes establish the session range and directional bias. Price sweeps one side of the pre-session range — usually the Asia session extreme — and then sets direction for the remainder of the session.
The session box — the visual boundary of the 14:30–21:00 window — provides immediate context. When price opens at the lower end of the pre-session range and sweeps Asia lows, the probability of a bullish NY session is elevated. The mid-session period (roughly 17:00–19:00 UK) tends to be quieter with a higher false-signal rate. Many professional crypto scalpers restrict their activity to the 14:30–17:00 window for this reason.
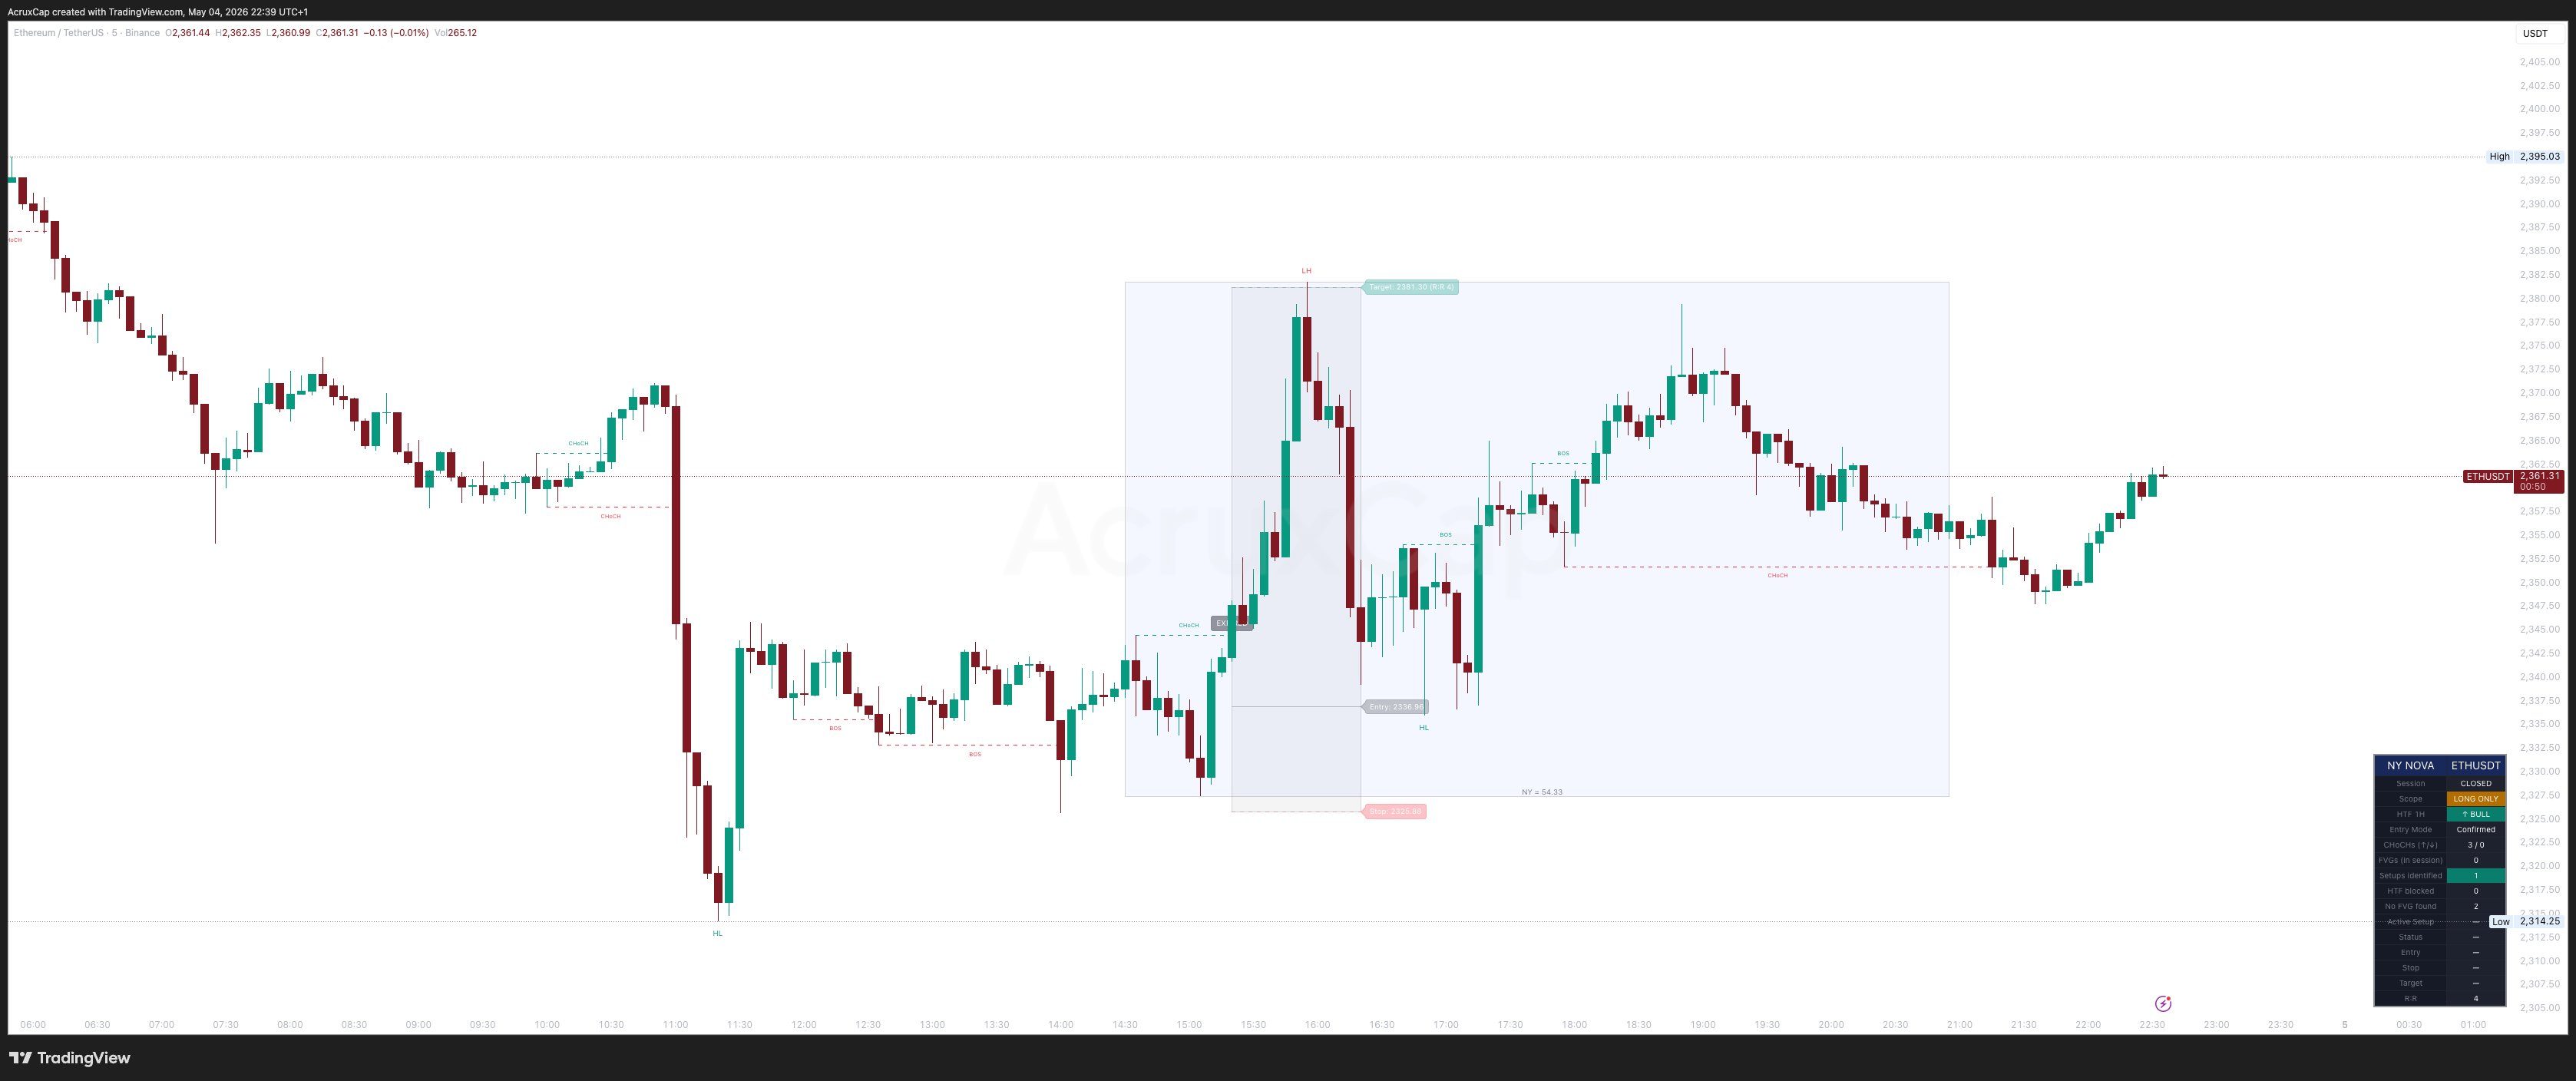
The FVG Retrace Framework
The Fair Value Gap retrace framework is built on a simple observation: when price moves impulsively during the New York session, it frequently creates inefficiencies — gaps in the order book where no two-sided trading occurred. These FVGs act as magnets for subsequent price action, and the retrace into an FVG after an initial displacement is one of the most statistically consistent patterns in crypto intraday price action.
The framework requires three conditions to align. First, a Change of Character on the lower timeframe confirms the prior directional structure has shifted. Second, the displacement must leave a valid FVG — a clear gap between the high of candle one and the low of candle three. Third, the 1H bias must be aligned with the trade direction. When all three align and price retraces into the FVG, the setup offers defined risk, defined entry, and a clear target. The 4:1 R:R framework means positive expectancy is achievable at win rates of 20–27%, as validated in the NY Nova backtest.
The Three Gates
The three-gate framework prevents entry on incomplete setups. Each gate must pass in sequence.
Gate 1 — Structure break (CHoCH). A bullish Change of Character must occur during the NY session window. This confirms that buyers have taken control of the lower timeframe structure. Without this, there is no directional confirmation.
Gate 2 — HTF bias alignment. The 1-hour bias must be bullish. A bullish CHoCH on the 5-minute chart carries much higher probability when the 1-hour chart is making higher highs and higher lows.
Gate 3 — Valid FVG present. The displacement leg that created the CHoCH must contain a valid fair value gap. The FVG is the entry zone — without it, the trade lacks a defined entry mechanism and does not trigger.
Validated Backtest Results
NY Nova was validated across 365 days of Binance spot data on the 1-minute timeframe, across five crypto symbols, executing every identified setup at 1% risk per trade. Results demonstrate positive expectancy across all five symbols despite win rates of only 20–27%.
LTC/USDT delivered the strongest result — 27.1% win rate, 4.33 average R:R, and a 72% net return over 365 days. BTC/USDT delivered the most modest result — 20.7% win rate, 4.19 average R:R, and a 10% net return. Every symbol was positive, confirming the methodology has edge across different crypto assets rather than being over-fitted to a single instrument. These results illustrate the methodology under consistent conditions — live performance will differ based on slippage, spread, and discretionary judgment.
NY Nova
NY Nova implements the three-gate FVG retrace framework as a TradingView overlay. It monitors the 14:30–21:00 UK window and draws the complete setup — entry, stop, and 4:1 target — when all three gates pass. Setup lifecycle states (ARMED, TOUCHED, INVALIDATED, EXPIRED) keep the trader informed without manual tracking. Validated on 1m, 5m, and 15m timeframes.